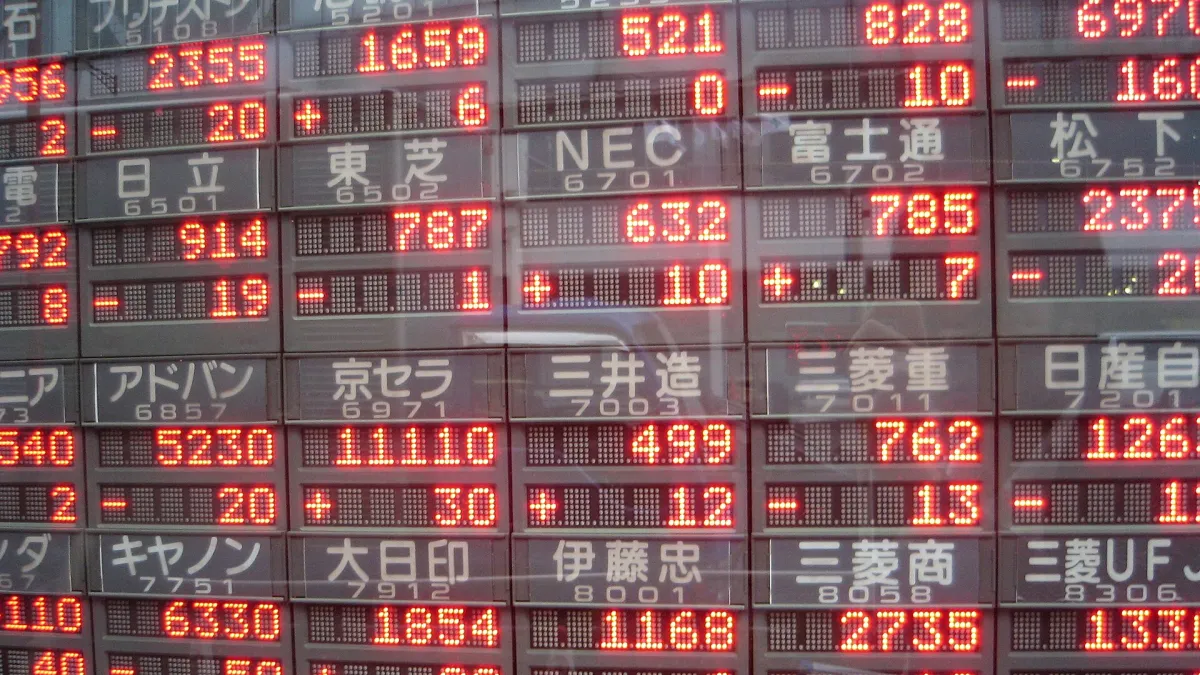
The benchmark land price survey — 基準地価, the prefectural survey that runs six months behind the January official land price announcement — landed on 16 September with a valuation date of 1 July. It is the better of Japan's two annual land readings for seeing momentum rather than level. The January announcement fixes a price once a year; this one asks again half a year later. Read together they produce four consecutive six-month windows on the same streets.
What they show for the Tokyo area is a market still rising at double digits on residential land and around ten per cent on commercial — and one that has already passed its fastest six months.
The second official reading of the year
Nationally the survey covers 21,466 benchmark sites, and the ministry's published roundup carries the detail. The all-use average rose 1.5%, a fifth consecutive annual increase, with residential land at 1.0% and commercial at 2.9%. The Tokyo area ran at 5.4% all-use, 4.0% residential and 8.9% commercial — the strongest of the three big metropolitan regions, ahead of Osaka's 3.6% and Nagoya's 1.9%.
Inside Tokyo the concentration is severe. The metropolitan government's own summary puts the prefecture-wide all-use average at 7.9%, a fourteenth consecutive year of gains, and the 23 central wards at 11.1%. Every one of the 350 residential benchmark sites in those wards rose; so did all 364 commercial sites. Minato's residential average rose 16.3%, against 13.7% a year earlier — the fastest ward in the city, and accelerating.
What the halves say that the headlines do not
The survey publishes a table most coverage ignores: the change at sites it shares with the January announcement, split into two six-month halves, across 1,589 common points. For the Tokyo area, residential land rose 2.6% between July 2025 and January 2026, then 2.3% between January and July 2026. Commercial land went 5.0%, then 4.5%.
Those figures matter because the January survey published the identical overlap period and reached the identical answer — 2.6% and 5.0% at 1,587 shared points. Two separately conducted national surveys, published six months apart, agreeing to the decimal on the same six months is the closest thing this market offers to a cross-check.
Chained across a year, Tokyo-area residential land reads 2.4%, 2.6%, 2.3%. The middle six months were the peak, and the run since has eased. The annual figures are still large. The direction of the second derivative is not.
Minato: the address as the asset
The most expensive residential land in Japan remains a plot in Akasaka. The survey prices Akasaka 1-14-11 at ¥7,500,000 a square metre, up 16.6%, and marks it the national high for the eighth year running. The January announcement had the same address at ¥7,110,000. Six months, plus 5.5%.
Around it the ward's prime points cluster tightly: Roppongi 5-13-1 at ¥3,520,000 and up 17.3%, Nishi-Azabu 3-15-8 at ¥2,760,000 and up 17.4%, Minami-Aoyama 4-26-18 at ¥2,870,000 and up 16.2%. The survey values land, not buildings, so a detached house plot and a tower site are priced on the same footing.
For a buyer working in dollars, the desk's rate of 155.05 puts that ¥7,500,000 at roughly US$48,400 a square metre, or about ¥697,000 — US$4,500 — a square foot. That is land only, and it is the top of the market rather than the middle of it: a Minato residential benchmark a few streets inland prices nearer ¥2.5m to ¥2.9m a square metre.
Marunouchi's puzzle: tighter offices, flat land
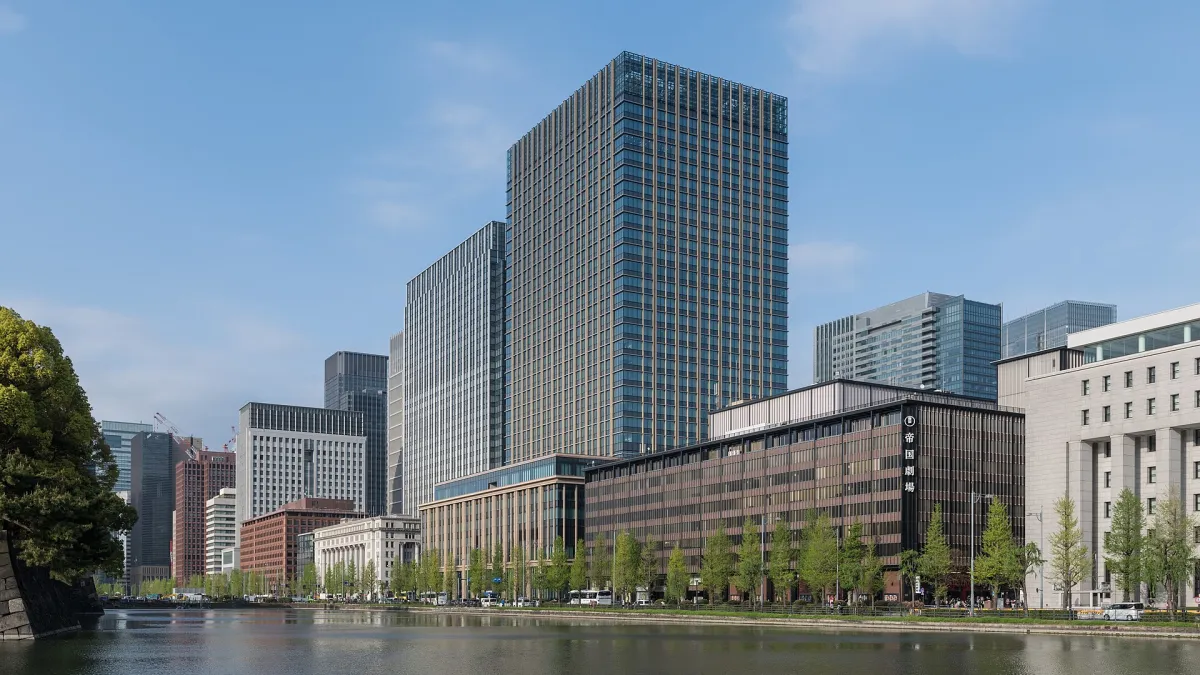
Now the counter-intuitive part. Marunouchi 3-3-1, the heart of the country's largest office district, is valued at ¥28,200,000 a square metre — second only to Ginza among Tokyo commercial land — and rose 3.3%. Otemachi 1-8-1 rose 3.5%. The Marunouchi plot stood at ¥27,500,000 in January, a half-year gain of 2.55%: a fifth of the pace of the Akasaka house site.
This is not weak office demand. Vacancy across the five central wards fell from 3% into the 1% range over the year to June 2026, and June's 1.99% was the first reading below 2% in about six years. Land price and occupational market are running in opposite directions, and the reason is arithmetic rather than sentiment: an office plot already built to its floor-area limit has no redevelopment option left to sell. The value has been booked. What rises is land where something can still be torn down.
Ginza shows the same effect in milder form. The national commercial high, Ginza 2-6-7, sits at ¥52,500,000 and rose 11.9% — a twenty-first consecutive year at the top — but only 5.9% of that arrived in the six months since January.
The redevelopment frontier
The survey's fastest prime Tokyo sites are all adjacent to something being built. Azabudai 3-4-10, beside the new Hills district, rose 16.0% to ¥5,280,000; the same point was ¥4,960,000 in January, a 6.5% half-year. Kōnan 2-13-37, in the Shinagawa station redevelopment zone, rose 16.0% to ¥6,320,000. Shibaura 4-5-16 rose 18.7%. North Shinagawa 5-9-28, at ¥1,960,000, was the fastest-rising residential benchmark in the whole Tokyo area at 18.8%.
Farther along the bay, Tsukishima 3-10-4 rose 14.3% and Nihonbashi 2-3-18 rose 14.2% to ¥12,900,000. Kachidoki, Harumi and Ariake — the tower districts on reclaimed land — sit far lower, between ¥1.2m and ¥2.3m a square metre, and rose between 6.8% and 17.0%.
That pattern is consistent with what the survey actually prices: a record of what a developer can still do with the site.
Chiyoda and Shibuya: two different premiums
Chiyoda holds the second-most-expensive residential land in the city and is rising at roughly half Minato's rate. Rokubanchō 6-1 is at ¥5,700,000 and rose 11.8%; Sanbanchō 9-4 at ¥4,530,000 and 11.9%; Kōjimachi 2-10-4 at ¥3,610,000 and 9.7%. At Rokubanchō the January figure was ¥5,300,000, so the six-month move was 7.5% — strong in isolation, but from a base nearly twice Minato's typical prime site and with a far smaller annual rate.
Shibuya's residential prime is showing more heat than its commercial. Jingūmae 3-13-13 rose 15.3% to ¥2,720,000 and Sarugakuchō 18-29 rose 15.0%. Yet Dōgenzaka 2-29-19, at ¥21,000,000, rose 8.2%, with a half-year of 3.45%. The station-side office and retail land is behaving like the rest of the established commercial core; the residential lanes behind it are behaving like the frontier.
The supply floor underneath
The most important number in this year's Tokyo data is not a land price. Housing starts across the prefecture fell 13.7% in the fiscal year to March, with condominium starts down 39.2% and the three central wards — Chiyoda, Chuo and Minato — down 56.8%.
New condominium supply in the 23 wards ran at 2,684 units in the first six months of 2026, down 9.4%, at an average ¥142,490,000 a unit and ¥2,226,000 a square metre, up 10.5% on the metre. Second-hand transactions rose 11.6%. Central Tokyo is not delivering new stock, and buyers are absorbing the existing stock instead.
That is the floor under the land market, and it is a supply floor rather than a demand story — the same conclusion this desk reached about the Peak, arrived at from the opposite direction. The difference is that the Peak's floor is permanent; Tokyo's is a consequence of current construction economics.
What a Peak or London buyer should take from this
Tokyo prime differs from the Peak in the mechanism that sets price. On the Peak the stock is finished, sellers are families who do not need to transact, and value is a negotiation between people who can wait — which is why that market goes quiet rather than cheap in a downturn. Tokyo's prime is supplied. Developers price against a business plan, and the land moving fastest in this survey is the land adjacent to whatever they build next. Supply can be interrupted, as the starts data shows, but it cannot be abolished.
Against post-non-dom London the difference is the tax line. London's prime has spent two years sorting the buyers who came for the tax from the buyers who came for the life. Tokyo is not running that experiment; its binding constraint on new central housing is construction and land assembly, not a regime change.
A buyer comparing the three should hold one thing straight. The January announcement is the next official reading, and this market has now told us twice, at 1,587 and 1,589 shared points, that the pace of increase is easing while the level is not. Level is what you pay. Pace is what you are being offered as a reason to hurry.