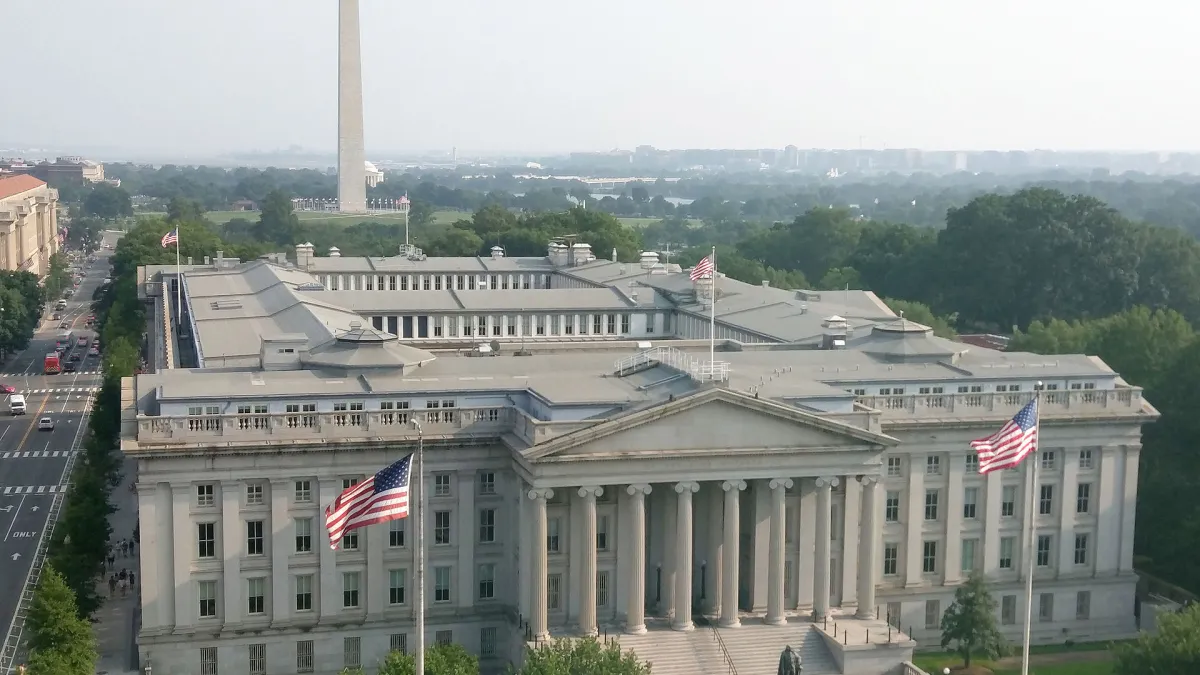
Asian and American cash markets are shut for the weekend, which leaves the number left on the screen at 21:15 Hong Kong time on Saturday as the one that counts: the ten-year United States Treasury note at 5.00%. Friday's session had closed it at 5.01% in the Treasury's own par yield curve, the daily series this desk reads from the published file, and the week behind it did everything a round number is supposed to do. That curve put the ten-year at 4.96% on Friday 11 September and 4.97% on Monday the 14th, then 5.00% on Tuesday the 15th, 5.01% on Wednesday the 16th, 4.94% on Thursday the 17th, and 5.01% again on Friday. Four consecutive sessions, three closes at or above 5%, one round number that would not stay crossed.
The first 5% readings since July 2007
Read every daily observation in that curve from 2 January 2007 to 18 September 2026 — 4,933 of them — and the ten-year reaches 5% on exactly 33 days. Thirty fall between 7 June and 19 July 2007. Three fall this month. Not one of the years from 2008 to 2025 contains a single reading at or above that level, and the highest of 2023 was 4.98%. That is the arithmetic behind the "highest since 2007" phrase the wires reached for in the middle of the month — Bloomberg-sourced copy on 11 September, Seoul Economic Daily on the 13th — and it says something slightly stronger. The par curve had not put the ten-year at 5% for more than nineteen years.
One thing to keep straight about the tape those headlines came off. The par curve is a snapshot, not a close: the Treasury derives its yields from indicative, bid-side price quotations gathered by the Federal Reserve Bank of New York at or near 3.30pm each trading day, and from those quotations interpolates a yield for every tenor, whether or not a bond of exactly that maturity exists. Market yields therefore traded through 5% before the curve closed there. Seoul Economic Daily reported on 13 September that the ten-year topped 5% during the 11 September session — a session the curve closed at 4.96%. Both statements describe the same week. The par curve is used here because it is the one series the Treasury publishes for every tenor, every session.
What moved was not the long end
Why the ten-year crossed 5% matters less than why it would not stay, and the shape of the curve answers that plainly. Between Friday 11 September and Friday 18 September the par curve moved most at the short end: three years, up 14 basis points to 4.83%; two years, up 13 to 4.76%; six months, up 12 to 4.24%. The ten-year added five, to 5.01%. The twenty-year finished the week unchanged at 5.38%. The thirty-year ended a basis point lower than it began, at 5.34%.
A term premium does not behave that way. When a long yield climbs because investors want more compensation for lending for a decade, the far end of the curve moves furthest and the front end barely notices. This week ran the other way round. What repriced was the expected path of the policy rate — how many times the Federal Reserve will move, and how far — rather than how much anyone feared holding a ten-year note. A ten-year that reaches 5% because the front end is climbing is a different instrument from one that reaches 5% because nobody wants duration, and a headline cannot tell them apart.
The Fed's part was smaller than it looked
The Federal Open Market Committee (FOMC), chaired by Kevin Warsh according to the Federal Reserve's own board listing, met on 15 and 16 September. Its statement, released at 2pm on the Wednesday, raised the target range for the federal funds rate by a quarter of a percentage point, to 3.75% to 4%. The vote was 12 to 0. The committee said inflation "remains elevated" and that the move would support "a timelier return" to its 2% goal, closing with a sentence it does not always use: "The Committee will deliver price stability."
The ten-year closed at 5.01% that afternoon, the highest reading in the par curve since July 2007, on the day the Fed hiked. The next session it fell seven basis points; the session after that it gave them back. A quarter-point increase delivered into a long bond that had already priced it is a confirmation rather than a shock, and confirmations get sold.
What the auctions would absorb
The auctions are where the long end states its price, and this month's said more than the ten-year did. On 9 September the Treasury sold $39 billion of ten-year notes at a high yield of 4.834%, with bids covering the offer 2.71 times. It was the ninth ten-year sale of the year and the ninth to clear above the one before it: the ladder runs from 4.173% on 12 January to 4.834% in September, 66 basis points across eight months, on offers that swung between $39 billion and $42 billion.
That sale, and the $22 billion of thirty-year bonds sold the next day at 5.308%, were absorbed with almost no dealer footprint. Indirect bidders — the category that includes foreign central banks, overseas institutions and investment funds — took 79.0% and 79.3% of the two issues, and primary dealers, the banks obliged to bid at every auction, were left with 4.3% and 2.2%.
Five sessions later it went differently. On Tuesday 15 September, the first session the par curve closed the ten-year at 5.00%, the Treasury reopened $13 billion of twenty-year bonds at a high yield of 5.420%, the highest at any twenty-year sale in the eighteen months of results on file. The cover of 2.57 was respectable. The composition was not: indirect bidders took 52.1% of the issue, against 62.2% at August's new twenty-year, and primary dealers were left with 16.7%, against 12.3%. When the end-investor share drops ten points and the dealer share rises four, the market is not refusing the paper. It is deciding who has to hold it.
What a failed crossing is worth
A yield that crosses a round number and comes back within two sessions is usually read as a failed breakout, and in one market that is the whole story. Read across the curve, it says something narrower. The ten-year had to reach 5% twice before the long end would follow, and the long end never really did. The argument about whether the term premium has returned for good — the case At 5%, the ten-year note is the world's opinion poll set out when 5% was a forecast rather than a print — is not settled by a week in which the thirty-year fell.
What it means for a Hong Kong book
Hong Kong's short rates are set by the peg rather than by the local economy, which is the subject of this desk's Chinese-language piece on the transmission rather than this one. What the round trip changes here is the price of the duration a Hong Kong portfolio actually owns.
That duration is mostly not the ten-year. It is twenty-year and thirty-year paper held by insurers, pension mandates and family-office bond ladders, and the long-dated dollar credit quoted off those points. Those are precisely the sales where the mix shifted this month. A reader who watched only the ten-year's 5% saw a round trip; a reader who watched the twenty-year's indirect takedown fall to 52.1% saw the marginal buyer stand back and a dealer balance sheet step in. The second reader knows more about their own book.
Reinvestment is where it bites quietly. A ladder rolling a maturity this autumn buys twenty-year paper at 5.420% and thirty-year paper at 5.308%, richer rungs than anything bought in the first half of the year — and a twenty-year commitment in a market whose end-buyers are thinning. It pays for the holder who will not have to sell.
What to watch
Two dates matter more than any forecast. The FOMC next meets on 27 and 28 October, its published calendar shows, and the minutes of the September meeting arrive about three weeks after the meeting, as every set this year has. Before either, the auctions: ten-year sales this year have fallen between the 8th and the 12th of the month, twenty-year sales between the 16th and the 22nd.
The levels are the ones just set. A ten-year close above 5.01%, the high of this week, would say the round number has stopped acting as a ceiling. A close back below 4.94% would say the front end did all the work and has finished. On the twenty-year, the figure to carry forward is not the yield but the mix: indirect takedown at or below half, with dealers above a fifth, is what a thinning buyer base looks like before it appears in price.
The ten-year carries 5.00% into a weekend with nothing trading. Its next honest price comes with October's sales, if the monthly pattern holds; its next honest opinion, on 28 October.